Cryptocurrency trading has become a mainstream investment avenue, attracting individuals from various backgrounds. While the crypto market offers immense profit potential, it is also notorious for its volatility and unpredictability. Chart patterns and visual representations of price movements over time are invaluable tools for traders looking to gain an edge.
Chart patterns play a critical role in navigating this landscape, giving you a glimpse into the market’s mindset. Master these patterns and position yourself ahead of the trend, potentially riding the wave to remarkable profits. So, let’s dive into the world of chart patterns and uncover the secrets they hold for crypto traders.
Also Read: 7 Things to Think About Before Buying Crypto in 2023
Learn These 5 Must-Know Chart Patterns for Guaranteed Success
#1. The Bullish and Bearish Engulfing Pattern

These short-term continuation patterns appear when the market consolidates after a sharp move in price, forming a flag-like structure. The pattern consists of a flagpole, followed by consolidation within a narrow range that forms the “Flag”. A bullish flag forms after a strong upward move, indicating a likely continuation of the uptrend.
On the other hand, a bearish flag follows a sharp downward move, suggesting a potential continuation of the downtrend. The Cardano (ADA) price chart exhibited a distinct bullish flag pattern in February 2021, leading to a subsequent surge in price. Flag patterns are short-term and typically play out over a few days to weeks.
However, the volume is crucial for their reliability. A decrease in volume while the flag is forming, followed by a surge when the price breaks out of the flag, can increase the pattern’s reliability.
#2. The Double Top and Double Bottom Pattern
This pattern is relatively straightforward to spot, consisting of two consecutive peaks (Double Top) or troughs (Double Bottom) at around the same price level. It suggests that the crypto asset fails to break through a resistance or support level, indicating a potential trend reversal.
Take, for example, the double bottom pattern in the Bitcoin (BTC) price chart in June and December 2018. The asset tested a low price twice before initiating a prolonged uptrend, demonstrating a robust double-bottom formation.
For the double top and bottom pattern, volume plays an essential role. For a more reliable signal, the volume should decrease during the second top or bottom formation and increase when the price breaks through the intervening trough or peak. Remember, the more significant the volume surge during the breakout, the more reliable the pattern.
#3. The Head and Shoulders Pattern
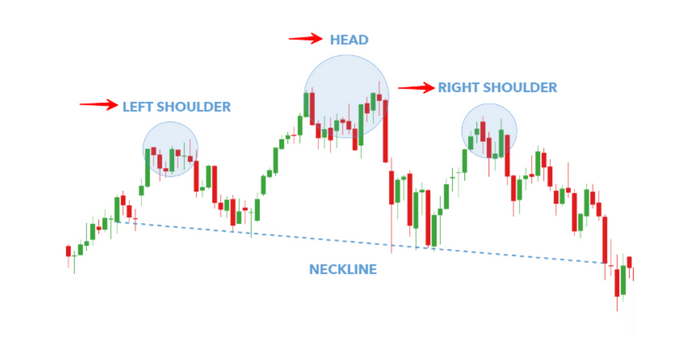
The head and shoulders pattern is a classic in technical analysis. It signifies a potential trend reversal and appears at the end of an uptrend. The pattern consists of three peaks – A higher peak (The Head) flanked by two smaller peaks (The Shoulders).
Consider the Bitcoin price chart during the December 2017 peak. A well-defined head and shoulders pattern emerged just before the significant downturn in January 2018, providing a timely sell signal for traders who recognised the formation. When the price drops below the neckline after forming the right shoulder, it’s time to act.
One crucial thing to remember about the head and shoulders pattern is that it’s not complete until the asset’s price breaks the neckline. While the pattern might initially seem to be forming, it may not always be complete, leading to what is known as a “Failed” head and shoulders pattern.
#4. The Ascending and Descending Triangle Pattern

Triangles are critical tools in the crypto trader’s toolkit. An ascending triangle forms when a crypto asset’s price fluctuates within a narrowing range, with consistent highs and higher lows. Conversely, a descending triangle consists of consistent lows and lower highs. These patterns often precede significant price movements.
Ascending triangles generally suggest bullish sentiments, with a breakout likely to occur upwards. In contrast, descending triangles often indicate bearish trends. The Ethereum (ETH) chart in April 2021 is a perfect example of a descending triangle leading to a sharp price decrease.
An essential aspect of triangle patterns is their “Breakout”. Typically, the price breakout should occur about two-thirds to three-quarters of the way through the triangle. If the price reaches the apex of the triangle without a breakout, it’s generally better to ignore the pattern as it’s less likely to give a reliable signal.
#5. The Cup and Handle Pattern
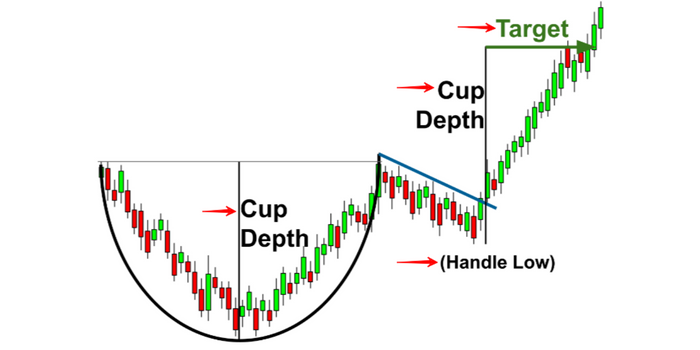
This pattern, shaped like a teacup, is a bullish continuation pattern signalling a period of consolidation before a breakout. The “Cup” forms when the price drops and rises to the same level. The “Handle” is a small downward drift before an upward breakout. It’s worth noting that while the cup and handle pattern is less common in cryptocurrency markets, when it does occur, it often precedes substantial price increases.
The Bitcoin price chart showed a clear cup and handle in late 2020, just before the massive bull run. One of the vital things to consider with the cup and handle pattern is the depth of the cup. Ideally, the cup should not be too deep. If the cup’s bottom is lower than the previous trend’s start, it might indicate a reversal pattern instead of a continuation pattern.
Also Read: 6 Bitcoin Alternative Cryptocurrencies That May Go Mainstream in 2023
Mastering the Patterns
Mastering these patterns is not just about recognising them on a chart; It’s about understanding what they signify. Here’s a step-by-step table to better understand the concept.
| Step | Description |
| Pattern Recognition | Spot potential patterns forming on the chart. |
| Pattern Confirmation | Wait for the pattern to form fully before making any trading decisions. |
| Combine with Indicators | Use other technical indicators such as Relative Strength Index (RSI), Moving Average Convergence/Divergence (MACD), or moving averages to further validate the pattern. |
| Understand Market Conditions | Assess the current market trend to decide if the pattern will likely be effective. |
| Risk Management | Set your stop-loss and take-profit levels to manage your risk effectively. |
| Execute the Trade | If all steps align, execute your trade with confidence. |
Frequently Asked Questions
How Reliable Are These Chart Patterns?
Chart patterns are useful for interpreting market sentiments but are not infallible. Using them in conjunction with other technical indicators and fundamental analysis is best.
Are These Patterns More Suitable for Short-Term or Long-Term Trading?
While these patterns generally apply in short-term and long-term scenarios, patterns like the double top, double bottom, and head and shoulders often play out over longer periods.
Can I Use These Patterns for Automated Trading?
Yes, many traders program these patterns into algorithms for automated trading. However, understanding the nuances of these patterns can provide a valuable check against over-reliance on automated systems.